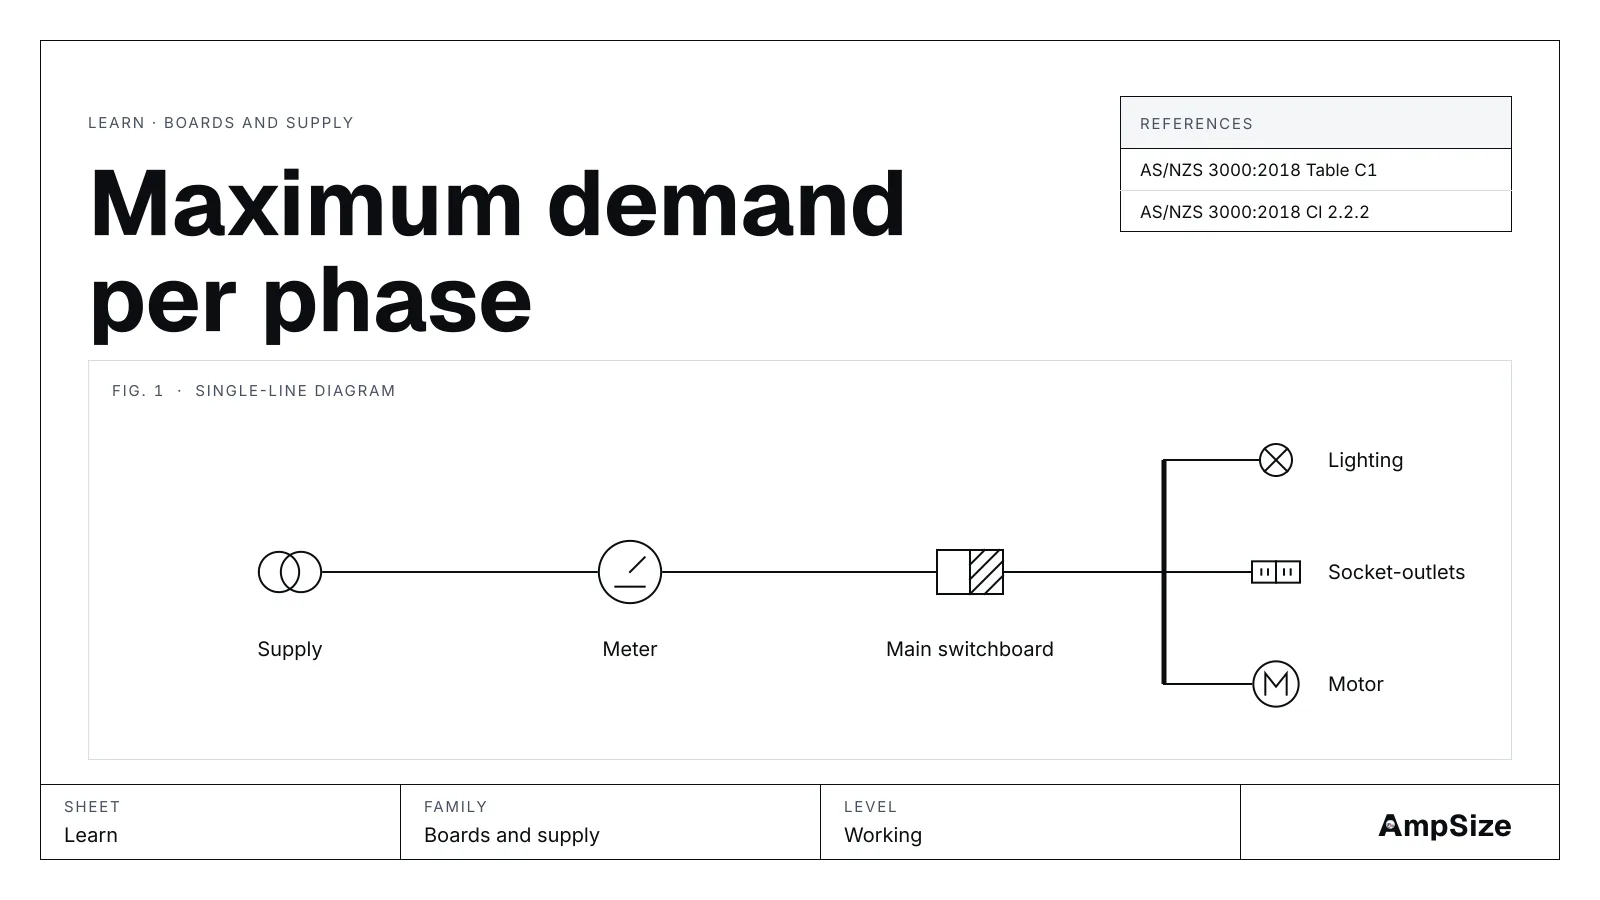
A three‑phase supply has three phases. Loads sit on one phase each. The supply must carry the busiest phase. A total in amps for the whole board does not show that. This page shows how to find the demand phase by phase.
Why per phase
Single‑phase loads do not share equally. A cooker on L3 does not help L1. If one phase carries most of the load, it reaches its limit first. The other two phases stay light.
The maximum demand calculation therefore runs on each phase on its own. The result is the demand on L1, L2 and L3. The heaviest of the three is the figure that sizes the service for that case.
AmpSize applies the demand rule to the loads on each phase, then reports the heaviest phase. The paragraphs of Appendix C that cover phase assessment are C2.3.2.2 and C2.4.2.
The inputs
You enter a list of loads. Each row has three parts.
- A load group from the demand table
- A quantity in the unit of that group, such as points, kW or amps
- The phase it sits on: L1, L2 or L3
The tool offers Table C1 for domestic loads and Table C2 for other premises. For Table C2 you also choose an occupancy.
A worked board
Use Table C1 at 230 V. The loads are these.
| Phase | Group | Quantity |
|---|---|---|
| L1 | A(i) lighting | 30 points |
| L1 | F storage water heater | 3 kW |
| L2 | B(i) socket‑outlets up to 10 A | 25 points |
| L3 | C ranges, cooking and laundry | 8 kW |
The tool applies the rule for each group.
- L1. The lighting rule gives 5 A for 30 points. The storage heater counts in full: 3 kW is 13.04 A. The sum is 18.04 A.
- L2. The socket‑outlet rule gives 15 A for 25 points.
- L3. The cooking rule counts half of 8 kW, which is 4 kW. At 230 V that is 17.39 A.
The heaviest phase is L1 at 18.04 A. The three demands sum to 50.43 A.
Open the per-phase tool with these loads.
The imbalance figure
The tool also reports an imbalance of 16.85 %. It compares the heaviest phase with the lightest. Here that is 18.04 A against 15 A. The gap is 3.04 A, which is 16.85 % of 18.04 A.
A high imbalance is a design prompt. Move a load to a lighter phase and run the tool again. The heaviest-phase figure falls, and the supply can be smaller.
Per phase against the whole board
The max demand tool treats the installation as one. It gives a single figure. The per-phase tool answers a different question. It shows which phase limits the supply and by how much.
Use the per-phase tool when a supply application asks for demand by phase. Use it too when a retailer or a network asks about balance.
Where it goes wrong
All loads go on L1. A quick entry puts every row on the default phase. Set the phase for each row.
A three‑phase load is entered on one phase only. A three‑phase load draws from all three phases. Split it across the phases.
The wrong table is chosen. Table C1 is for domestic loads. Table C2 is for other premises. The groups differ.
The unit is wrong. Some groups take points. Some take kW. Some take amps. The tool names the unit for each group.
The line voltage is entered for the phase voltage. The tool asks for the phase voltage, line to neutral. Enter 230 V, not the 400 V between lines.
Use the result as a design aid. Verify every value against the current edition of the standard.
See also: Maximum demand and diversity, Office fit-out maximum demand per phase with Table C2 and Block of units maximum demand with Table C1, three phase.