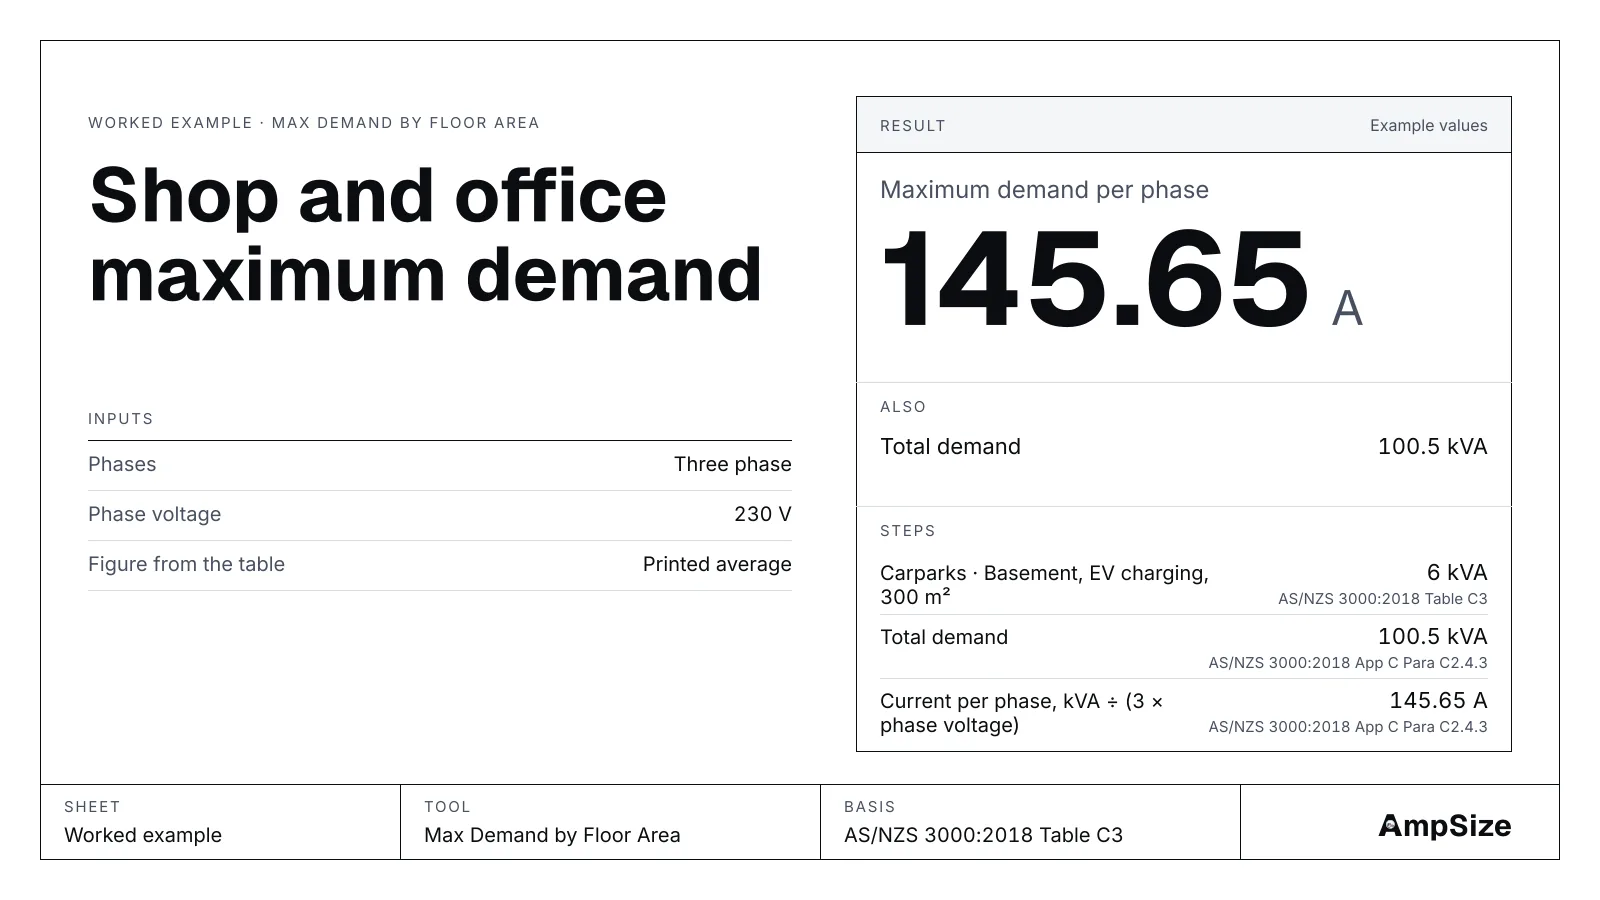
You know the floor areas of a new building. You do not know every light and air conditioner yet. This guide finds the maximum demand from the areas alone. It uses the floor area demand calculator and AS/NZS 3000:2018 Table C3. The method is explained in The energy demand method and Table C3.
The building
- A two-level building on a 230/400 V three‑phase supply.
- Ground floor: 600 m² of retail shops, with air conditioning.
- First floor: 400 m² of offices, with reverse cycle air conditioning.
- A basement carpark of 300 m², with EV charging.
Step 1. Pick a figure for each area
Table C3 gives each use a range in VA/m² and an average. Start with the average. It suits most designs.
- Shops, light and power: 70 VA/m². Shops, air conditioning: 30 VA/m².
- Offices, light and power: 50 VA/m². Offices, reverse cycle: 25 VA/m².
- Basement carpark: 15 VA/m².
Open the tool with this building.
Step 2. Add the EV charging
The NOTE to Table C3 puts EV charging on top of all other energy demands. Keep the basement row. Add the basement EV charging row too. It prints 20 VA/m² on average.
Open the tool with the EV charging added.
Step 3. Read the total and the current
Each area gives kVA = area × VA/m² ÷ 1000. The tool adds them. It then divides by 3 × 230 V to give the current in each phase.
| Area | VA/m² | kVA |
|---|---|---|
| Shops, light and power, 600 m² | 70 | 42 |
| Shops, air conditioning, 600 m² | 30 | 18 |
| Offices, light and power, 400 m² | 50 | 20 |
| Offices, reverse cycle, 400 m² | 25 | 10 |
| Basement carpark, 300 m² | 15 | 4.5 |
| Basement EV charging, 300 m² | 20 | 6 |
| Total | 100.5 |
The maximum demand is 100.5 kVA. That is 145.65 A per phase. Without the EV charging row, the total is 94.5 kVA and 136.96 A per phase.
Step 4. Test the range
The printed range is wide. Run the high and low ends to see how far the answer can move.
| Figure from Table C3 | Total demand | Per phase |
|---|---|---|
| Low end of the range | 66 kVA | 95.65 A |
| Printed average | 100.5 kVA | 145.65 A |
| High end of the range | 135 kVA | 195.65 A |
Use the high end for a hot climate or long opening hours. Use the low end only when you have good reason. Tell the client which end you used.
Step 5. Check the limits
- The per phase figure assumes the load spreads evenly. Check the heaviest phase when the shops and the offices sit on different phases.
- Table C3 prints no figure for special equipment. Add it in kVA from its load details.
- When the loads are known, run Table C2 in the Maximum Demand tool and compare. See Commercial maximum demand with Table C2.
For the reason behind each step, read The energy demand method and Table C3.