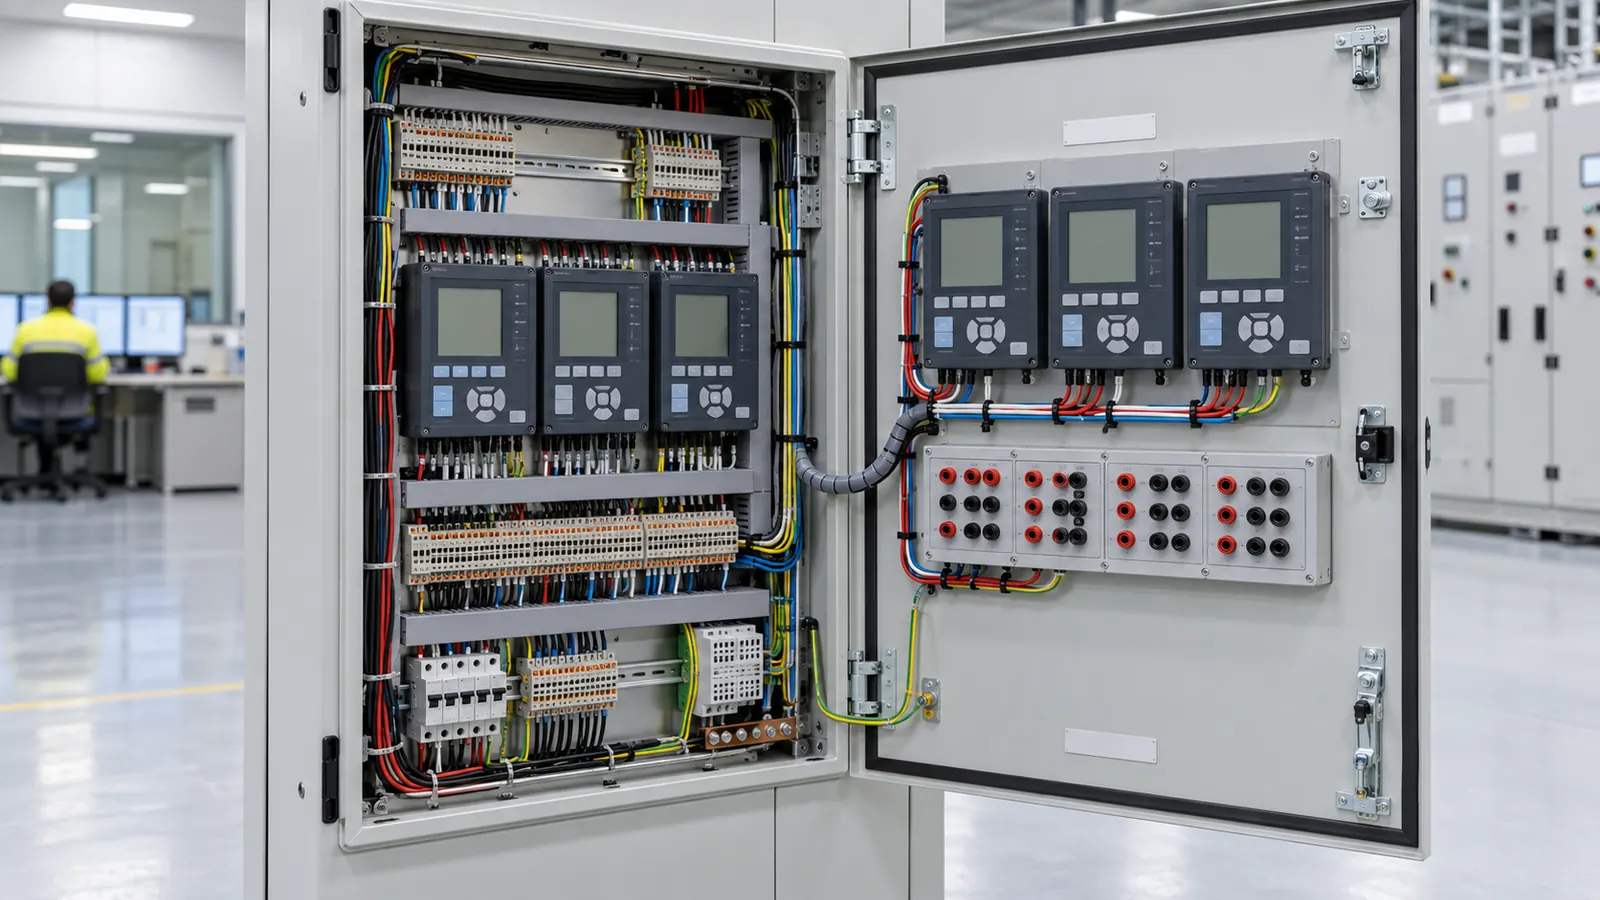
Protection grading turns into a chart argument fast. Two relays on one riser, two curves, and a question about which one opens first. The chart answers it in three numbers.
The question
A 100 A feeder sits under a 250 A incomer. A fault on the feeder draws 2000 A. The feeder relay must clear that fault. The incomer relay must hold long enough for the feeder to finish. The gap between the two trip times is the grading margin.
The inputs
- Fault current: 2000 A
- Feeder relay: IEC standard inverse, pickup 100 A, TMS 0.1, no instantaneous element
- Incomer relay: IEC standard inverse, pickup 250 A, TMS 0.3, no instantaneous element
Both relays run the same curve shape. Only the pickup and the time multiplier separate them. That is the usual starting point on a small industrial board.
The clause
The standard inverse curve constants come from IEC 60255-151 Cl 5.2 and its Annex A. Cl 2.5.7.2 of AS/NZS 3000:2018 covers discrimination between protective devices in an installation. Cite both by number in the protection schedule.
The steps
The tool takes the ratio of the fault current to the pickup current for each relay. It puts that ratio through the standard inverse equation. It then scales the answer by the time multiplier.
The feeder relay sees 2000 A against a 100 A pickup. That is 20 times pickup. At TMS 0.1 the trip time is 0.23 s.
The incomer relay sees the same 2000 A against a 250 A pickup. That is 8 times pickup. The lower ratio moves the relay further up the curve. At TMS 0.3 the trip time is 0.99 s.
The margin is the difference between the two. The tool reports 0.76 s between the feeder and the incomer at 2000 A.
The result
The grading holds. The feeder clears in 0.23 s and the incomer is still counting at that instant. The tool raised no warning on this pair, so the margin sits above the threshold it checks.
Two effects combine to produce the 0.76 s gap. The higher pickup on the incomer puts it at a lower multiple of pickup, which lengthens its time. The higher time multiplier stretches that result again. Either change on its own would be tighter.
Read the margin at the fault current that matters, not at the top of the chart. The curves converge as the current rises. A pair that grades at 2000 A can fall inside the margin at 10000 A. Run the same relay pair again at the board fault level before the settings go to site.
The TMS 0.1 on the feeder is close to the practical floor for an electromechanical relay. A numeric relay will hold it. If the margin needs to grow, raise the incomer TMS rather than drop the feeder. Dropping the feeder gains little and costs cable withstand margin.
What the chart does not show
An instantaneous element ends the role of the curve above its threshold. This example has none on either relay. An instantaneous setting on the feeder would cut the 0.23 s to a fixed operating time above its threshold. The margin at 2000 A would change with it.
The trip times are relay operating times. They do not include the circuit breaker opening time or the relay output contact time. Add those before the margin goes into a report. A 0.76 s figure with 50 ms of breaker time on each end is still comfortable. A 0.35 s figure would not be.
This page is a design aid. Verify every value against the current edition of the standard.